
Historical Hurricane Examples
Category 1
Hurricane Barbara 2013Category 2
Hurricane Ernesto 2012Category 3
Hurricane Sandy 2012Category 4
Hurricane Dennis 2005Hurricane
Harvey 2017
Dumped 51 inches of rain over parts of Texas, and tied hurricane Katrina as the most costly tropical cyclone.Hurricane Laura
8-27-2020
Dramatic drone video
captures
devastation.Category 5
Hurricane Andrew 1992Hurricane Patricia
Strongest Hurricane in the Pacific to make landfall. On October 23, 2015 hurricane Patricia became the strongest hurricane on record in the Western Hemisphere with 200 mph sustained winds.Hurricane Dorian became a category 5 in 2019 and is the strongest hurricane known to have hit the Bahamas.
A nice site to help with hurricane preparedness
The U.S. had the most landfalls by named storms in 2020.
Hurricane Ida in 2021 tied the strongest winds ever to hit Louisiana.
The Saffir-Simpson hurricane wind scale was developed in 1971 by Herbert Saffir a civil engineer and Robert Simpson a meteorologist. The Saffir Simpson hurricane wind scale contains 5 categories of wind speeds. The 5 categories of wind speed indicate expected damage to structures. Category 3 and higher hurricanes are considered major hurricanes. The higher categories are indicative of greater occurrence of damage. An updated version of the scale became operational on May 15, 2010 removing pressure and storm surge transforming it into a pure wind scale (SSHWS). In 2012 the National Hurricane Center (NHC) made slight adjustments to the wind speeds within the categories. This hurricane category chart with wind speed can be seen below.
Storm surge which is often associated with hurricanes causes the most property damage and is the greatest threat to life. Storm surge when coinciding with normal high tide can cause particularly extreme flooding. Storm surge is caused by water being pushed toward the shore and inland by the force of the winds associated with winds moving cyclonically around the storm. Low pressure from the hurricane usually causes minimal storm surge when compared to the water being forced toward the shore by the wind. Other factors included but not limited to influencing storm surge are width, depth and slope of continental shelf, angle of approaching hurricane to coast line and shape and features such as bays and estuaries of the coast.
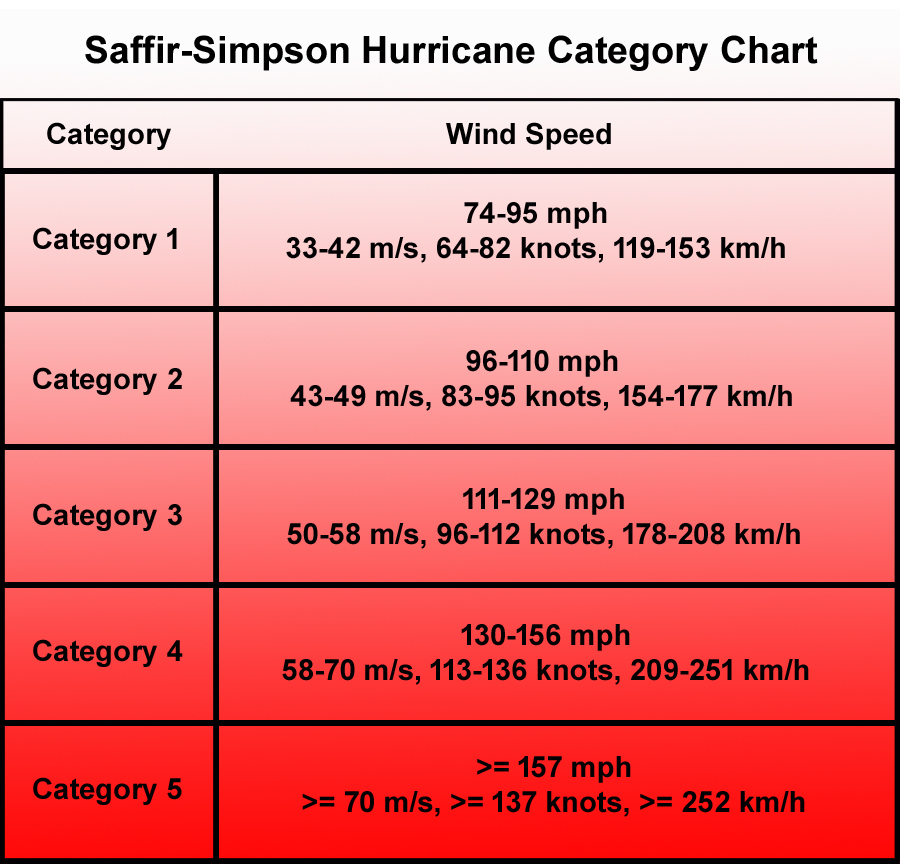
Category 1
Very dangerous but usually no significant damage to most well-constructed structures. Damage may occur to mobile homes and poorly attached roof shingles. Possible power outages.
Category 2
Extremely dangerous often causing damage to mobile homes, roofs, doors and windows. Boats may break moorings. Extensive power outages and loss of potable water possible.
Category 3
Devastating damage occurs possibly causing structural damage to homes and buildings, particularly those with wood frames. Mobile homes are usually destroyed and often trees are uprooted or snapped. Coastal and inland flooding may occur. Power may be lost for weeks and water contamination is likely.
Category 4
Catastrophic damage may include extensive curtainwall and structural failures on homes and small buildings. Mobile and manufactured home are usually destroyed. Tree loss is common and extensive. Flooding may be far inland. Power and water loss for weeks can be expected.
Category 5
Most powerful hurricanes associated with catastrophic damage and extremely high wind speeds. Homes and buildings may be destroyed or blown away. Mobile homes and manufactured homes experience total devastation and are usually flattened. Most all trees are uprooted or snapped and may be debarked. Power and water loss may be months.
Category 6
Currently this category does not exist, but many suggest it should be introduced as a few storms have occurred with winds greater than 174 mph and more may occur if climate change begins to affect the strength of hurricanes in the future.
The number of hurricanes has changed over time. Below is a storm / hurricane count chart for the Atlantic Basin by thevane.com over the last 165 years.
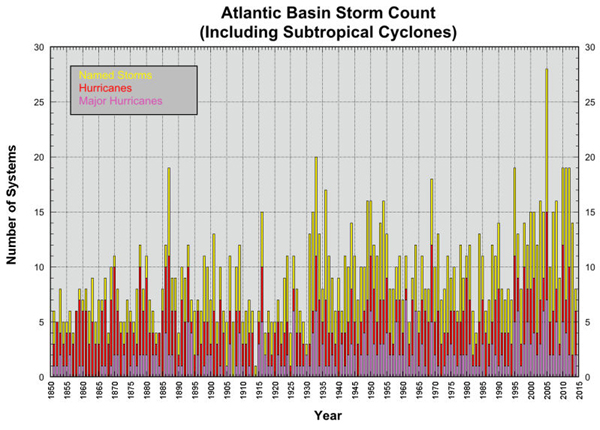 Atlantic Basin Storm Count from 1850 to 2015 (Merserea, 2015)
References:
Merserea, David, 2015, Despite El Niño, Atlantic Ocean Keeps Cranking Out Tropical Cyclones, http://thevane.gawker.com/i-m-not-tired-of-hearing-about-el-nino-when-if-there-s-1729396793
NOAA, 2015, Saffir-Simpson hurricand wind scale
NOAA, 2015, Storm Surge Overview
Wikipedia, 2015, Saffir-Simpson hurricane wind scale
Wikipedia, 2019, Hurricane Harvey